Stock Idea
About the company
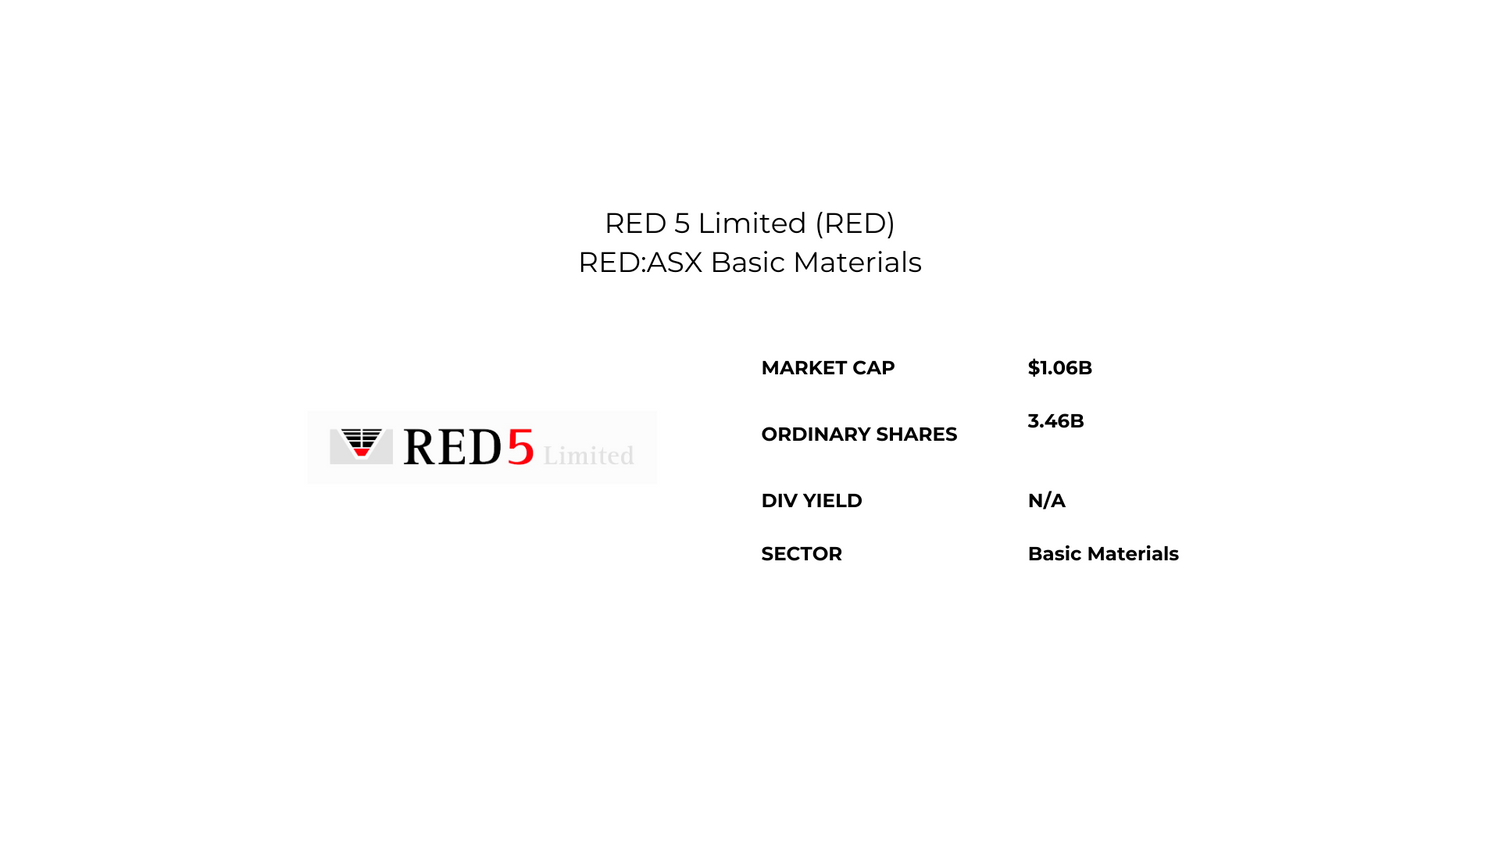
Red 5 Limited engages in the exploration, production, and mining of gold deposits and mineral properties in the Philippines and Australia. It holds interests in the Siana Gold project located in the Island of Mindanao, the Philippines; the King of the Hills Gold project located in the Eastern Goldfields of Western Australia; and the Darlot Gold mine situated in the north-east of Perth in Western Australia. The company was incorporated in 1995 and is based in West Perth, Australia.
The Technicals
*Please note this is general advice only
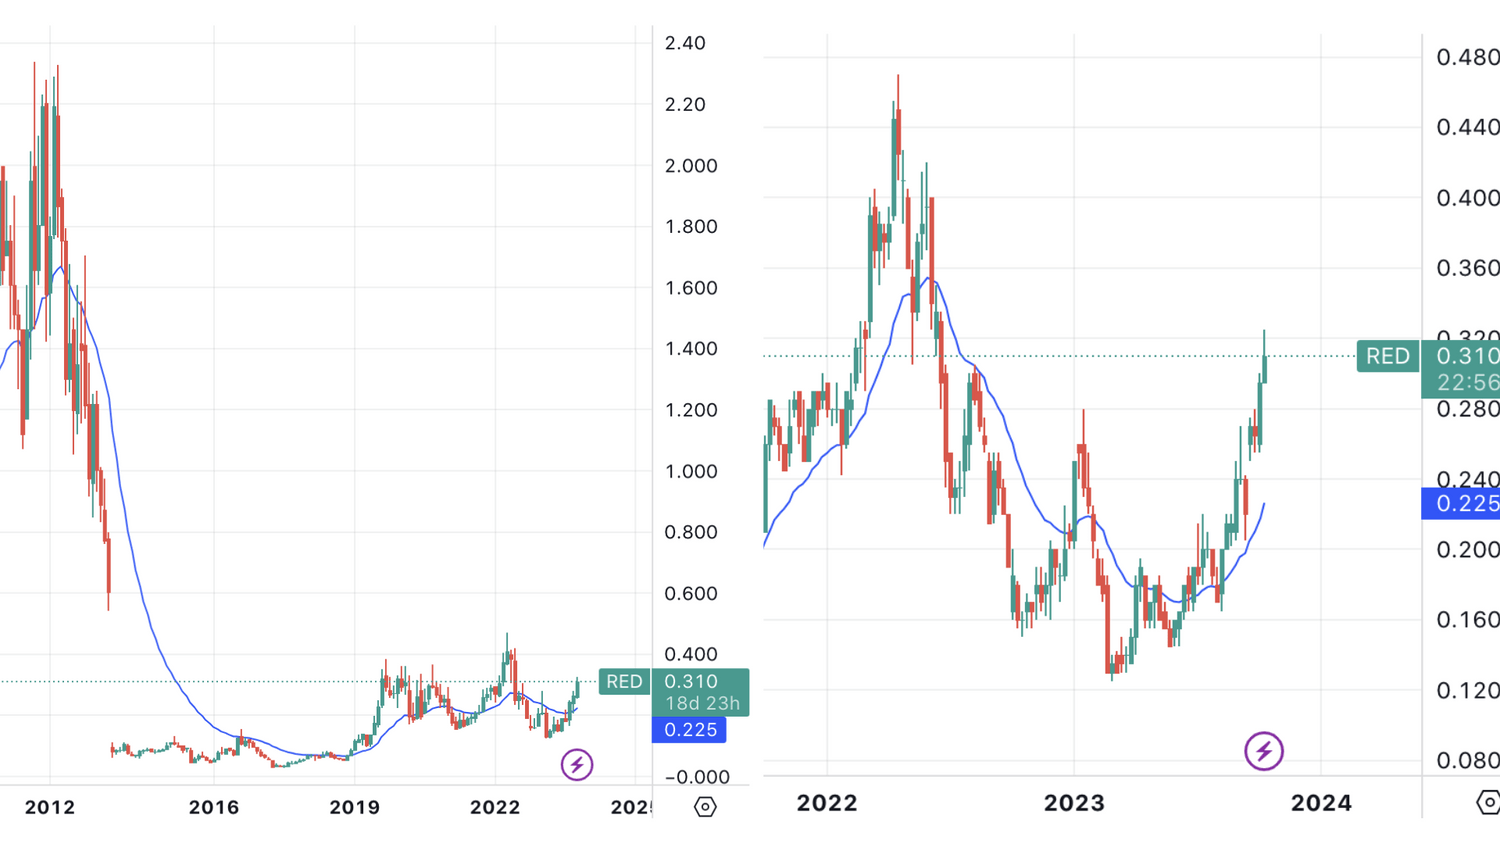
Looking at the monthly chart for Red 5 Limited, it's evident that the stock has been on an impressive upward trajectory. It all began when the stock found solid support in the low teens and rebounded strongly. Now, it's been trading above my exponential moving average for three consecutive months, which is a positive sign.
When we take a closer look at the monthly chart, we can spot a gap that needs filling and a significant number of untapped price levels sitting above the current price. To achieve this from a technical standpoint, several factors need to align. However, it's essential to note that this potential move is primarily based on technical analysis, rather than fundamental factors.
In other words, it seems like Red 5 Limited has the technical indicators pointing towards a promising future. The recent bounce off the low teens and the sustained trading above the exponential moving average suggest a strong bullish trend. The unfulfilled gaps and untouched levels on the chart provide further room for potential growth. Of course, it's important to consider the broader market context and company-specific fundamentals, but right now, the technical signals are looking quite favourable.
Monthly Chart on the Left - Weekly Chart on the Right
Looking at the weekly chart, it's pretty clear that this stock is on a roll. We've got this nice pattern going on with higher highs and higher lows. That's a sign of a strong upward trend. It means that over time, the stock is consistently reaching new peaks that are higher than the previous ones, and even during its downswings, it's finding support at higher levels.
What's interesting is that when we compare the weekly chart to the monthly chart, we're really getting a closer look at the nitty-gritty of this stock's upward journey. The monthly chart provides a big-picture view, while the weekly chart dives deeper into the details. It's like zooming in to see how this stock is climbing the ladder. This pattern of higher highs and higher lows on the weekly chart is a good sign for traders and investors. It shows that the stock has been steadily moving up over the short term. This is just one piece of the puzzle.
I'm seeing a great buying opportunity with RED, and we're looking at a threshold that stretches up to 31.5 cents per share. To keep our investment safe, we've set an initial protective stop at 20 cents. However, it's worth noting that we'll be flexible with this stop if the stock makes a significant move upwards from its current position.
Our initial target for taking profits is at 47 cents per share, and beyond that, we're eyeing bigger gains at $1.17 and $1.45. Keep in mind that these levels are not set in stone, and we're open to making adjustments and revisions as the situation evolves. Flexibility is key in the world of trading, and we'll adapt our strategy as needed to make the most of this opportunity.
*Please note that the team at Tradeprofitably has exposure to the stock

General Consensus
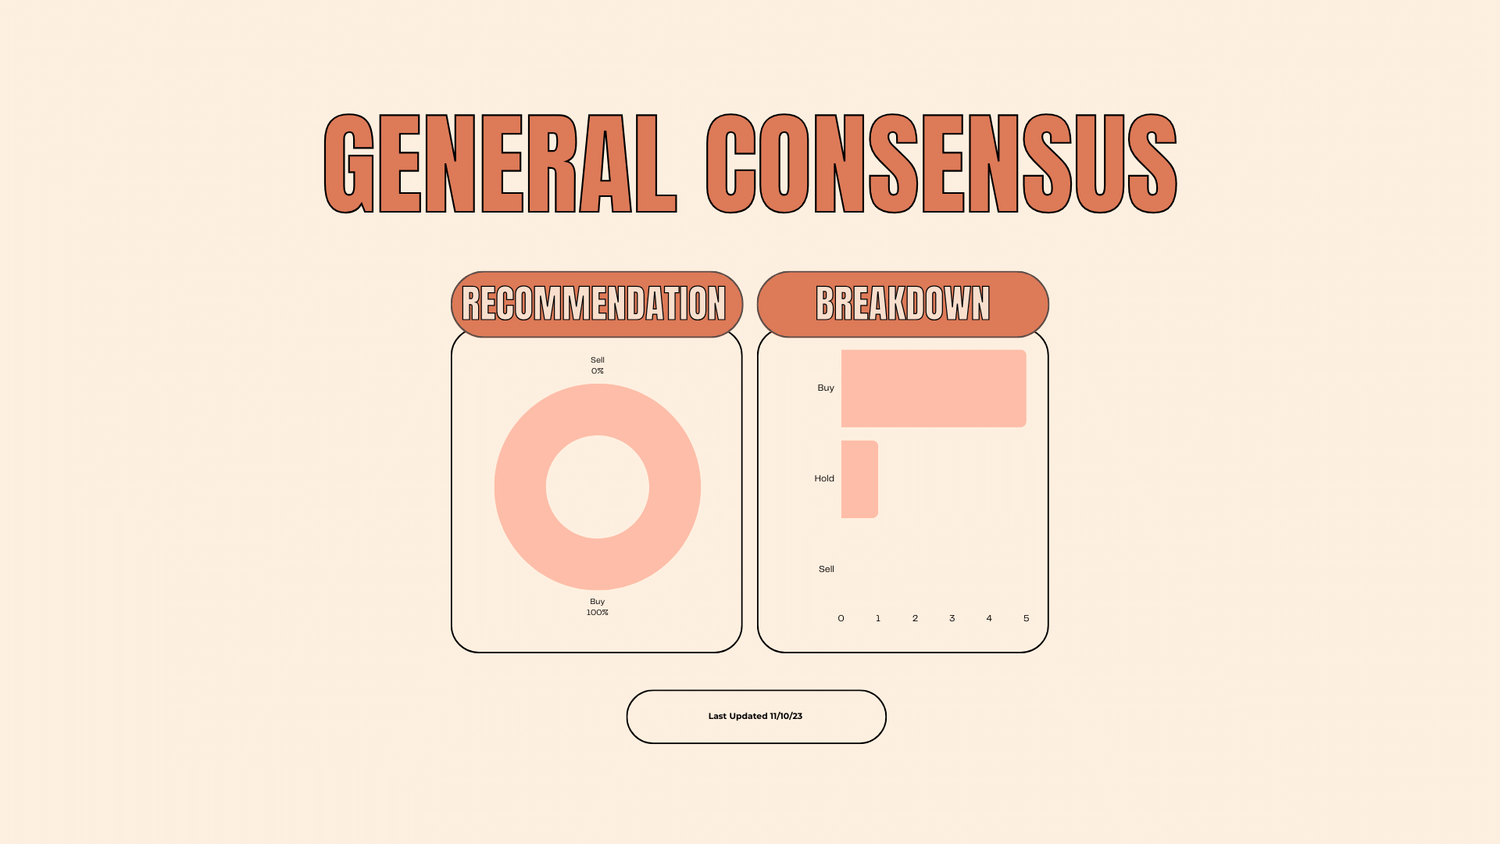
Out of six analysts, five are bullish on the stock, which is a good sign whilst one of them is a bit more cautious with a hold.

